| |
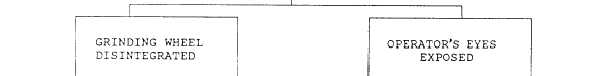
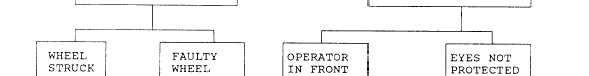
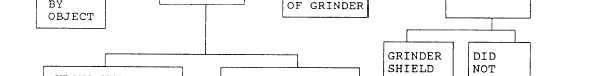
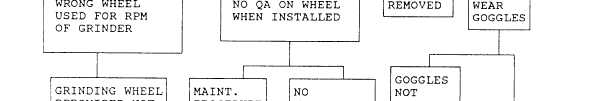
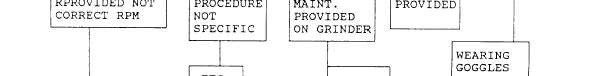
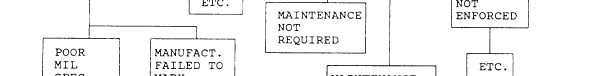
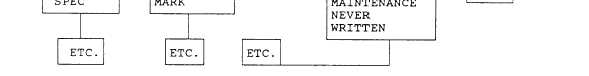
Figure 4-4.—Sample fault tree diagram.
symbolic diagram on paper showing “what if ”problems
(fig. 4-4). It also branches off into other components
affected by the failure. Analyzing mishap investigation
information works backwards from the final failure to
the original component. It shows the cause-and-effect
relationship of systems.
CHANGE ANALYSIS.— Change signals trouble.
A change in the steering of the ship or a change in the
sound of an engine may signal trouble. Departures from
the norm may be an element in the chain of events
leading to a mishap. Changes interact with subsequent
changes. A change in a Maintenance Requirement Card
(MRC) could cause a change in frequency of the
maintenance. The change in frequency could change the
adequacy of the maintenance. The change in adequacy
of maintenance could change the reliability of the
equipment. The change in reliability could lead to a
mishap. Analyzing the changes that affected a system or
procedure may provide mishap causes. In a change
analysis, we compare a mishap situation with a similar
but mishap-free situation. We determine the differences
4-16
|