Click Here to
Order this information in Print

Click Here to
Order this information on CD-ROM

Click Here to
Download this information in PDF Format


Click here to make tpub.com your Home Page

Page Title: How to Graph Tide Data
Back | Up | Next

Click here for a printable version

Google


Web
www.tpub.com

Home

   
Information Categories
.... Administration
Advancement
Aerographer
Automotive
Aviation
Combat
Construction
Diving
Draftsman
Engineering
Electronics
Food and Cooking
Math
Medical
Music
Nuclear Fundamentals
Photography
Religion
USMC
   
Products
  Educational CD-ROM's
Printed Manuals
Downloadable Books


How to Graph Tide Data Introduction When  the  height  of  tide  is  required  for  a  number  of  times  on  a  certain day,  the  graphical  method  of  determining  tides  can  be  very  useful.  For example,  a  buoy  tender  may  spend  an  entire  day  servicing  aids  to navigation  in  one  particular  area.  Having  the  tides  displayed  on  a  graph for  the  entire  day  will  save  you  from  having  to  calculate  the  height  of tide  separately  for  each  aid  you  visit. To  illustrate  how  to  construct  a  tide  graph,  we  will  use  the  same  data presented  in  the  previous  section  for  the  height  of  tide  at  Tue  Marshes 
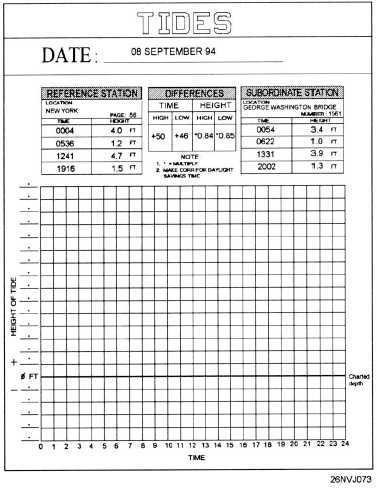
Light,  Virginia.  The  form  shown  in  figure  7-5  should  prove  helpful  in guiding  you  through  the  problem,  however,  regular  graph  paper  can  be used  if  you  desire. Figure  7-5.  Sample  tide  graph  form. 7-12

Privacy Statement - Press Release - Copyright Information. - Contact Us - Support Integrated Publishing

Integrated Publishing, Inc. - A (SDVOSB) Service Disabled Veteran Owned Small Business