| |
Pressure Areas
Frontal Weather
The atmosphere can produce
weather in other ways, of
course, but frontal weather,
which is often violent, can be
predicted from a chart of
pressure systems. Figure 10-5
shows different types of
pressure areas on a weather
chart.
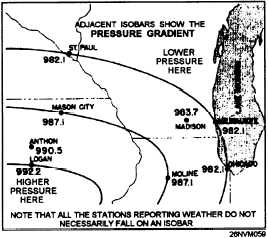
Isobars
Figure 10-5. Sample weather map.
Atmospheric pressure is reported in millibars. One atmosphere equals
14.696 pounds per square inch, a bar equals slightly more than 0.98
atmosphere, and a millibar equals 1/1000 of a bar.
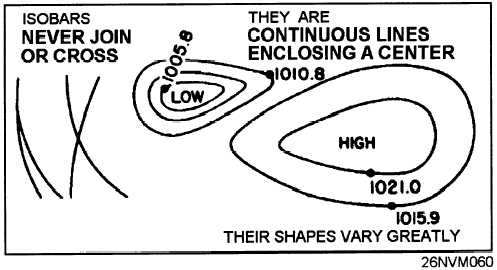
On weather charts, pressure is usually indicated in millibars
(fig. 10-6). The lines shown in the figure are drawn through points of
equal pressure and are called isobars.
Figure 10-6. Shapes of isobars.
10-13
|