| |
Example of a DR Plot
Example
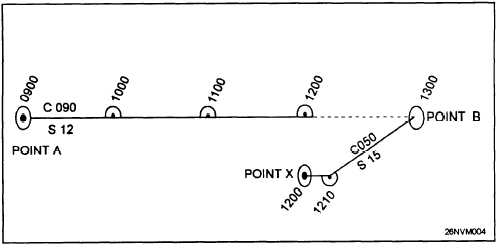
Figure 8-4 represents a sample DR plot. At 0900 your ship departs
point A en route to point B on course 090°T, speed 12 knots. In this
particular example, DRs are laid out every hour; you expect to arrive at
point B at 1300.
At 1200, you obtain a fix which places your ship 180°T, 5 miles from
your 1200 DR position (point X). If you were to maintain your original
course of 090°T, you will miss your destination; therefore, a correction
is necessary.
Since time was required to record and evaluate your fix and to decide a
new course and speed to reach your destination (point B), the change
cannot occur at the 1200 fix. Instead, you must DR ahead some point in
time. In this case, the navigator plots a 1210 DR position based on the
old, and still maintained, course and speed. From here the navigator
calculates the new course of 050° T, speed 15 knots. It is important to
remember that the course line will continue in the direction and speed
originally ordered during the time spent obtaining and plotting the fix
and while deciding a new course and speed.
Figure 8-4. Example DR plot.
8-10
|

