| |
How to Determine or Plot Direction on a Chart
Background
Information
Remember, meridians on a Mercator chart appear as straight lines,
parallel to and equidistant from one another. You know they represent
imaginary curved lines, not parallel to one another at all, but converging
at the poles. Appearance of meridians on a Mercator projection as
parallel straight lines is one of the most valuable features of this type of
projection, making it possible to plot a course as a straight line (a rhumb
line). On a Mercator projection, a rhumb line cuts every meridian at the
same angle. In other words, it is a line of the same bearing throughout.
Although it does not represent the shortest distance between the points it
connects, this fact is not important unless very large distances are
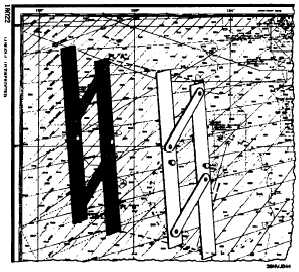
involved. Use the table and figure 1-13 to determine or plot direction.
Step
Action
1.
Identify the two points that you want to determine the direction to or
from. Example: Pt A and Pt B.
Lay one edge of the parallel rulers so that it passes through each
2.
point.
3.
Firmly press down on one side of the parallel rulers and begin to
move the ruler to the compass rose.
4.
Position the ruler so either edge passes through the center crosshair
of the compass rose.
5.
Use a pencil to mark the outside ring of the compass rose
6.
Read the bearing on the outside ring of the compass rose.
Figure 1-13. Plotting a position on a chart.
l-20
|

