| |
Pressure Areas, Continued
Isobars,
continued
Usually, isobars are drawn for equal intervals of pressure (every 4
millibar for example), and frequently, isobars do not pass through
reporting stations. Isobars never join or cross. Some may run off the
chart, but others may close, forming irregular ovals that define the areas
of highest and lowest pressure (fig. 10-6). Air (wind) flows from high-
pressure areas to low-pressure areas. The strength of the wind depends
upon two factors: the amount of difference in pressure and the distance
of the high-pressure area (high) from the low-pressure area (low). These
two factors combined are called pressure gradient. The greater the
gradient, the stronger the wind. Thus, isobars can give a rough
indication of the amount of wind. The closer an isobar is to another, the
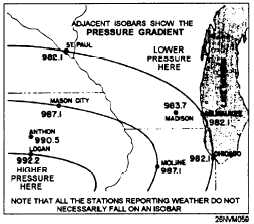
greater the amount of wind in that area. In figure 10-7, the isobars
represent pressures of 992.2 mb, 987.1 mb, and 982.1 mb.
Figure 10-7. Isobaric patterns.
The spacing and shape of isobars are seen in figure 10-6, which also
shows how complete isobars are formed. Isobars are always smoothed-
out curves, usually making irregular ovals around the high- or
low-pressure center.
Refer to figure 10-7 and you can see that only part of each isobar (the
upper right portion of the oval) appears in the diagram. In this pressure
system, that area of greatest pressure is at the system’s center. This
high-pressure area is also called a high or an anticyclone. If the
pressure is 992.2 mb at Chicago, 987.1 mb at Moline, and 982.1 mb at
Logan, the area of lowest pressure is in the vicinity of Logan. This area
would be a low, or a cyclone.
10-14
|