| |
How to Graph Tide Data, Continued
Step
1.
2.
3.
Action
Complete the upper section of the form by filling in the reference, subordinate, and differences data
for 8 SEP 93. Notice on the graph that time is listed along the bottom in even hours (interpolate
when necessary), and the height is listed along the left margin. The solid line at 0 feet is the base
line, or charted depth.
Set the height scale. Each line can represent one foot, one-half foot, one-tenth foot, and so on.
Try to use a scale that results in the largest graphical representation practical. In our example, the
largest increment we can use and still remain on the graph is 0.2 feet per line.
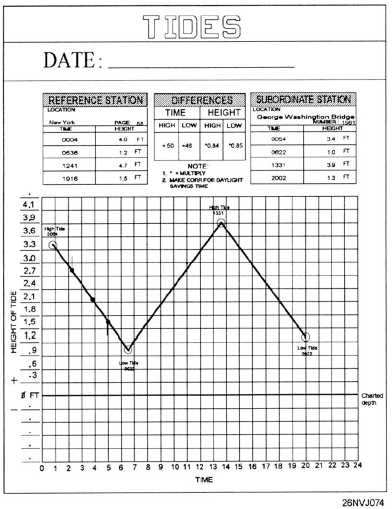
Plot the high and low tide times and heights on the graph (fig. 7-6). Use the subordinate station
data since you wish to know the tides at this location (Tue Marshes Light). Start with the first
time and height listed, 0057 at 0.6 feet. Plot as shown below. Continue by plotting the other three
points, then connect each point with a light line.
Figure 7-6. Plot the times of high and low water on the graph.
7-13
|