| |
How to Graph Tide Data
Introduction
When the height of tide is required for a number of times on a certain
day, the graphical method of determining tides can be very useful. For
example, a buoy tender may spend an entire day servicing aids to
navigation in one particular area. Having the tides displayed on a graph
for the entire day will save you from having to calculate the height of
tide separately for each aid you visit.
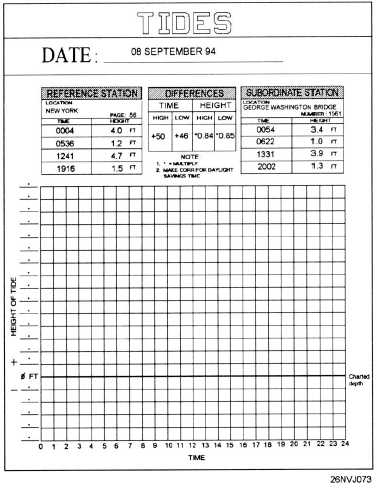
To illustrate how to construct a tide graph, we will use the same data
presented in the previous section for the height of tide at Tue Marshes
Light, Virginia. The form shown in figure 7-5 should prove helpful in
guiding you through the problem, however, regular graph paper can be
used if you desire.
Figure 7-5. Sample tide graph form.
7-12
|

